
By Jennifer Sikora, vice president of Marketing, CivicScience
Consumers do not seem hesitant to splurge on themselves, particularly since data shows that overall U.S. consumer confidence in personal finances is higher now than one year ago. The majority of U.S. consumers take opportunities to splurge – but their choices on what that splurge involves vary widely.
In a recent consumer research study conducted by CivicScience, the data show that 72% of 16,857 consumers polled admit that they splurge on themselves. Respondents were asked to pick from a range of options – both goods and services – to indicate their go-to choice when they make a splurge purchase. A clothing shopping spree is the highest-ranking choice overall among those who splurge, but there is a lot more to learn about those who select any of the splurge options.
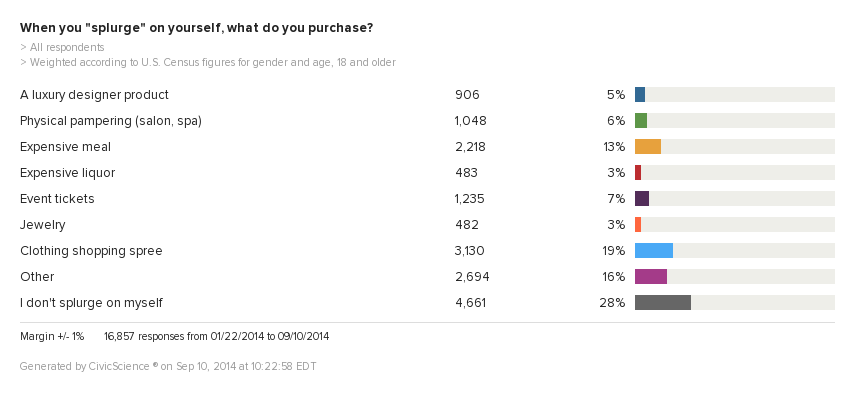
The first table below highlights attributes of those respondents who are more likely to select any of the “tangible” products – luxury designer products, expensive liquor, jewelry, and clothing shopping sprees – over other splurge choices:
|
A luxury designer product |
Expensive liquor |
Jewelry |
Clothing shopping spree |
|
Women 61% female vs. 39% male |
Men 72% male vs. 28% female |
Women 81% female vs. 19% male |
Women 75% female vs. 25% male |
|
Ages 18 to 44 |
Ages 25-29 and 35-44 |
Ages 55+ |
Ages 18-29 |
|
Income over $150K |
Income $100K-$125K and over $150K |
Income over $150K |
Income under $25K |
|
Neither a parent or grandparent |
Parent |
Grandparents |
Neither a parent or grandparent |
|
Spendthrift |
Spendthrift |
Spendthrift |
Spendthrift |
|
Exercises several times per week |
Exercises several times per month |
Never exercises |
Exercises several times per month |
|
Not active on Facebook |
Does not use Facebook |
Active on Facebook |
Active on Facebook |
This second table highlights attributes of those respondents who are more likely to select any of the services options – physical pampering, expensive meals, event tickets – over other splurge choices:
|
Physical pampering |
Expensive meal |
Event tickets |
|
Women 83% female vs. 17% male |
Men 61% male vs. 39% female |
Men 64% male vs. 36% female |
|
Ages 35-54 |
Ages 35-44 |
Ages 25-29 and 35-44 |
|
Income $125-$150K |
Income $100K-$150K |
Income $75K-$100K |
|
Parent |
Parent |
(Grandparents are less likely) |
|
Spendthrift |
Tightwad |
Neither Spendthrift or Tightwad |
|
Exercises several times per week |
(No differences in exercise frequency found) |
Exercises several times per week |
|
Active on Facebook |
Active on Facebook or just recently joined |
Active on Facebook |
Here are some interesting summary points we can find in this data:
What about those 28% of consumers who do not splurge on themselves? They are 39% more likely to be men; make under $50,000 per year; be an older adult, aged 45+ years; be a grandparent (they are 48% more likely not to splurge than parents and 126% more likely than non-parents); live in a rural area; and never or almost never exercise. They are also more likely to also characterize them self as a tightwad vs. more freely parting with their money. Perhaps among this segment, splurging may always be seen as an expensive activity.
From the data we found, people who do splurge in general say they are happier than those who don’t splurge. Hopefully those who do not take the opportunity to splurge on themselves can find more economical ways to treat themselves to something nice, as happiness is certainly worth it.
About the CivicScience Methodology:
CivicScience collects real-time consumer research data via polling applications that run on hundreds of U.S. publisher websites, cycling through thousands of active questions on any given day. CivicScience builds deep psychographic profiles of these anonymous respondents over time, providing valuable consumer sentiment data to the decision makers who care. The CivicScience methodology has been scientifically validated by a team of academic leaders and independent research firms. CivicScience currently has more than 27 million anonymous consumer profiles and 600 million responses stored, growing daily. For this report, CivicScience analyzed the data collected from 16,857 U.S.-based adults, weighted for U.S. census representativeness for gender and age (18 years and older), from January 22, 2014 to September 10, 2014.
Click here for more information from CivicScience.
About the Author:
Jennifer Sikora currently serves as vice president of Marketing at CivicScience. She has over 17 years of technology solution marketing experience, serving industries spanning retail and hospitality, manufacturing and supply chain, business and finance, and education. She is frequent guest columnist for many business and trade journals, and holds a bachelor’s degree in interdisciplinary studies/journalism from the University of Pittsburgh.
